


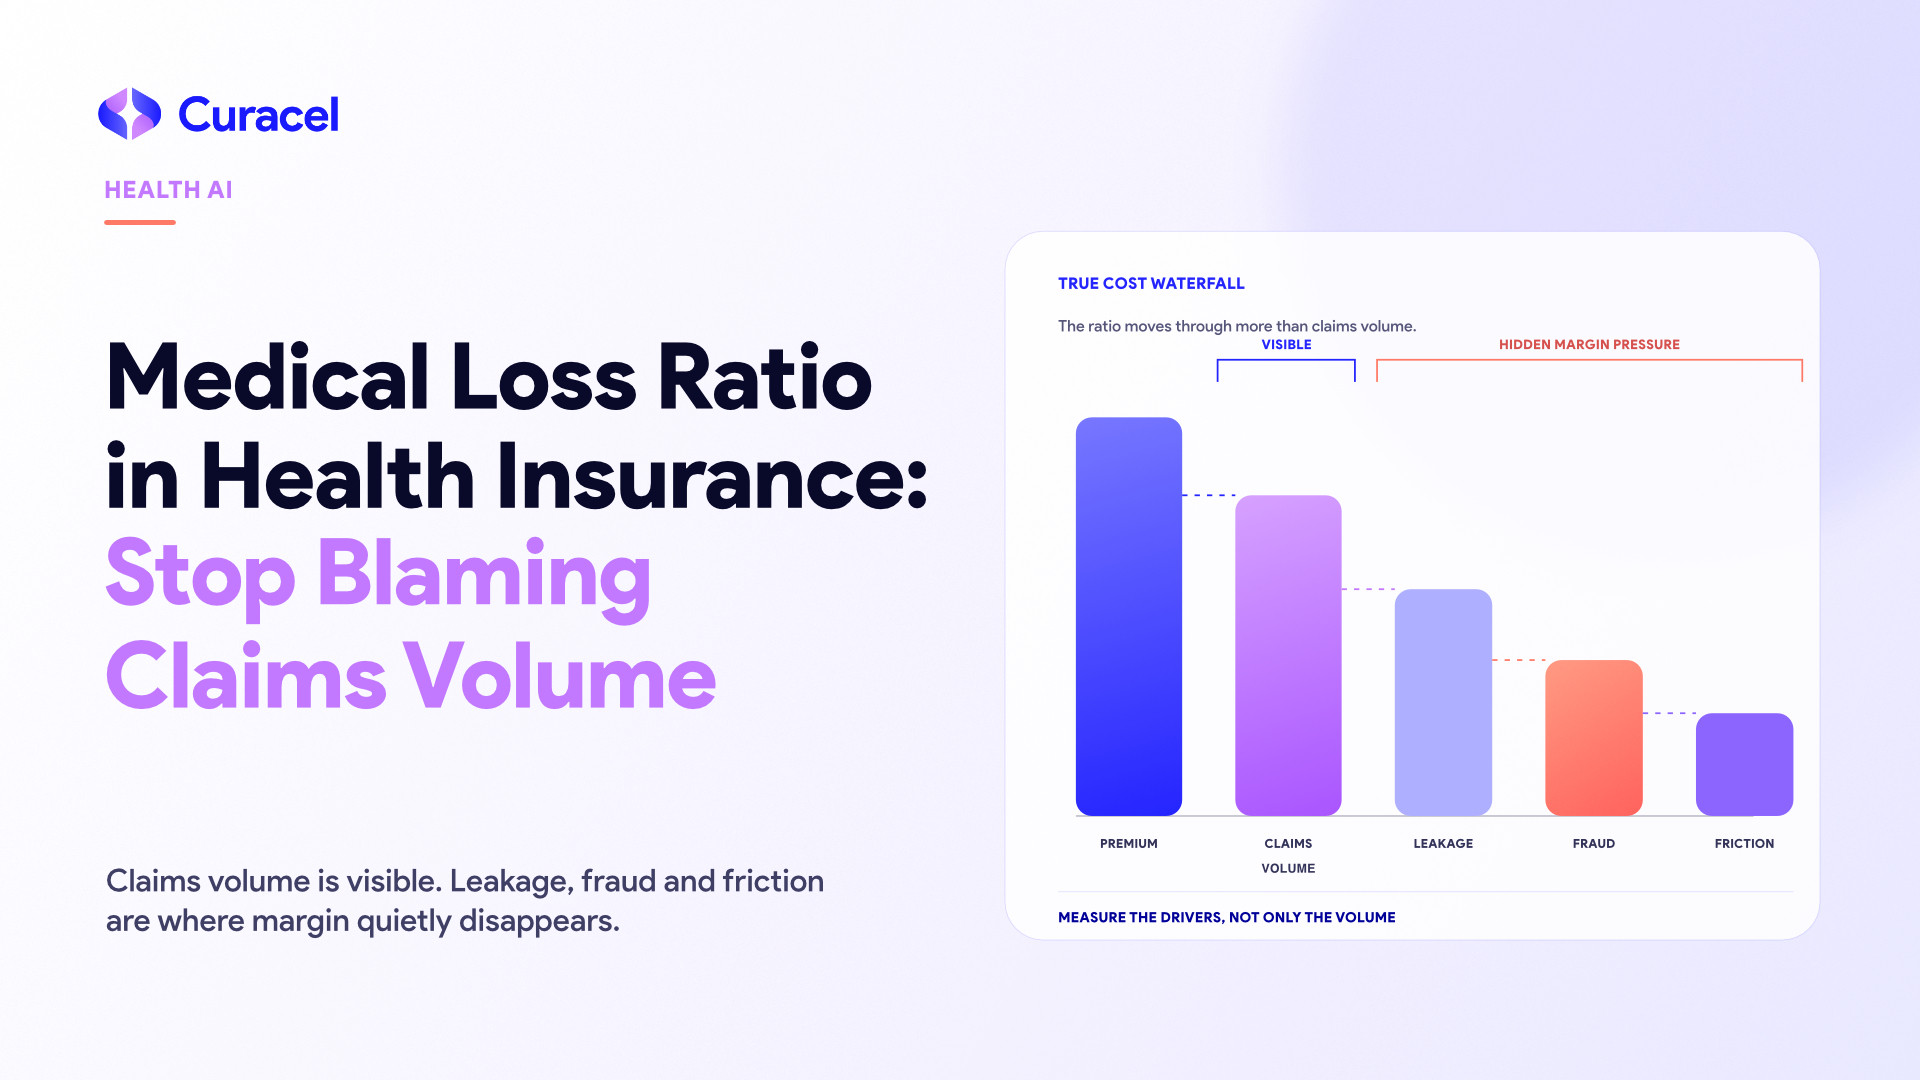
Medical Loss Ratio in Health Insurance: Stop Blaming Claims Volume
A rising medical loss ratio can trigger an immediate reaction: claims are up, so claims volume must be the problem.
That conclusion is convenient. It is also incomplete.
Medical loss ratio, or MLR, compares eligible claim and care-related costs with premium revenue under the definition used for the portfolio. Claim count affects the result, but so do average claim cost, membership and benefit mix, pricing, leakage, recoveries, and timing. If leaders diagnose the ratio from volume alone, they can apply the wrong fix to the wrong problem.
MLR Is a Signal, Not a Diagnosis
In the United States, Affordable Care Act rules generally require insurers to spend at least 80% of premium revenue on care and quality improvement in individual and small-group markets, and 85% in the large-group market. Insurers that do not meet the applicable requirement may owe rebates. Outside that U.S. context, use the definition set by the applicable regulator and contracts.
Even within the U.S. framework, MLR is not simply paid claims divided by gross premium. The regulatory numerator includes incurred claims and qualifying quality-improvement expenditure. The denominator starts with premium revenue and applies specified exclusions and adjustments.
The management lesson is broader than the regulation: a ratio can move because its numerator rises, its denominator weakens, or both happen together.
Decompose the Movement Before You Act
Start with a bridge from the prior period to the current one. Separate six drivers:
- Premium: Did earned premium keep pace with the covered risk, benefit design, and medical-cost trend?
- Frequency: Are more members using care, or are the same members claiming more often?
- Severity: Is the average allowed or paid amount per claim increasing?
- Mix: Has utilisation shifted toward higher-cost providers, procedures, drugs, locations, or member cohorts?
- Leakage: Are duplicate, ineligible, inflated, miscoded, or otherwise avoidable payments passing through controls?
- Recoveries: Are coordination-of-benefits, provider overpayments, subrogation, rebates, and other valid recoveries being identified and posted correctly?
Want to make this diagnostic operational? Explore Curacel Health AI for health-claims workflows and decision support.
Match the Intervention to the Driver
Once the bridge is visible, choose controls that address the actual cause:
- If frequency is rising, examine utilisation by member, diagnosis, provider, channel, and benefit before tightening access broadly.
- If severity is rising, inspect tariffs, treatment pathways, high-cost cases, drug mix, provider concentration, and authorisation rules.
- If mix is changing, compare the emerging portfolio with the assumptions used in pricing and network design.
- If leakage is present, strengthen pre-payment edits, anomaly review, provider feedback, and post-payment recovery.
- If premium is lagging risk, connect claims evidence to actuarial, underwriting, product, and renewal decisions.
Claims automation can support this work, but automation is not the diagnosis. Faster processing of weak rules can simply move bad decisions faster. The useful objective is a traceable control loop: detect the driver, route the right exception, measure the intervention, and feed the result back into pricing, benefits, networks, and operations.
Build an MLR Operating Cadence
A monthly MLR review should do more than report one percentage. Give each major movement an owner, an evidence trail, a corrective action, and a review date. Keep finance, actuarial, medical, network, and claims teams on the same driver definitions so that one team’s operational win does not create another team’s portfolio loss.
The Takeaway
Claim volume matters, but it is not a complete explanation for medical loss ratio. Treat MLR as a portfolio equation. Decompose premium, frequency, severity, mix, leakage, and recoveries before choosing an intervention.
If your team wants a clearer view of the claims signals behind the ratio, contact Curacel to discuss a Health AI workflow for your portfolio.
Subsribe to our newsletter to receive weekly content







.svg)


